Admin Area: The Records Page
The project records page is the central repository for your collected Coreo records. It provides you with both a map and table view of your data across all of the different forms within your project and enables you to view, filter, edit, delete and export your data, depending on your project permissions. The records page has several features to help you make the most of your data. To access your project records:
- Open your chosen project.
- Select ‘Records’ in the project side-panel.

Choosing Forms
For projects containing multiple forms and multiple survey types there will often be instances where you need to drill down on particular data and to keep your workspace organised. You can easily do so by selecting the forms you wish to have viewable on the map and in your records table. If you have added your forms to groups these will be displayed in the list. For more information on form groups see our user guide here.
To select your forms:
- Click the ‘Select Forms’ button in the upper left corner of the records page to open the forms drop down.

- Select the forms you wish to have open from the list in the dropdown.

- You can select/deselect all forms by clicking the ‘Select all forms’ checkbox.

Forms you have selected will be visible on the map, if they contain geometry, and each form will have its own tab in the record table. Records from all forms will be visible under the ‘All selected forms tab’. Any deselected forms will be entirely hidden from both the map and records table until selected from the form dropdown list. When exporting your data only the selected forms will be available for export.
The Map
There are several ways you can interact with and view your data in the records page map.
Navigating the Map
To interact with the map :
- Pan around the map by clicking and dragging.
- Zoom in and out by using your mouse or by using the plus and minus button on the left hand side of the screen.

- Rotate the map by clicking and holding the right mouse button.
- Should you need to reorient the map you can use the two arrows icon to orient your map north.

Centre the map on your location by selecting the crosshair icon. (You will need to grant location permissions in your browser of choice).

- View your map in fullscreen by clicking the full screen icon in the top left corner of the map.

- There is a measuring tool which can be used to measure both area and linear distance. To access the tool click the ‘ruler’ icon.

Map Layers
You can access all of your map layers via the map settings window, open it by:
- Clicking the ‘layer switcher’ icon.


The options available in map settings change depending on whether you have the UKHab survey included in your project or not. For a more detailed explanation of these feature see our UKHab user guide. Several options are universal across all types of project including selecting your basemap. There are currently 5 options to choose from:
- Streets: This is a vector map.
- Satellite (default)
- Sat/Streets: This is the satellite map with streets and location names overlayed
- Bing: Our highest resolution map (exclusive to the professional+ tier)
- Empty: No base map, instead a neutral grey background will be displayed
If you have a boundary set up in the Map & boundaries section of Coreo you can toggle it on here.

You can also zoom to your project boundary by clicking the small Magnifying glass.
The final universal feature is the ability to toggle custom map layers on and off.

You can find our guide for importing custom map layers here.
Editing Geometry
You can select any record on the map by clicking it, after which it will be highlighted on the map to show it has been selected.
As the table is paginated this selected record may be found on a different table page. If you are viewing the all records tab or the corresponding form tab in the records table the selected record will be selected and highlighted in the table.

You can edit the geometry of any selected record. To do so:
- Click the blue ‘pencil’ icon.

- You can now use the Coreo geometry tools to edit your record as needed. For more in depth information on the tools see our user guide here.
The Records Table
The records table displays your records and their data in tabular format. The records table is open by default but can be hidden by:
- Clicking the down arrow on ‘hide/show table’ icon.

You can also hide the map and view only the records table, to do so:
- Click the up arrow on the ‘hide/show table’ icon.

Note: If you’re working with a project that contains no geometry you will only see the records table with no map.
Form Tabs
By default a tab is present displaying records from all selected forms alongside a tab per form you have selected.
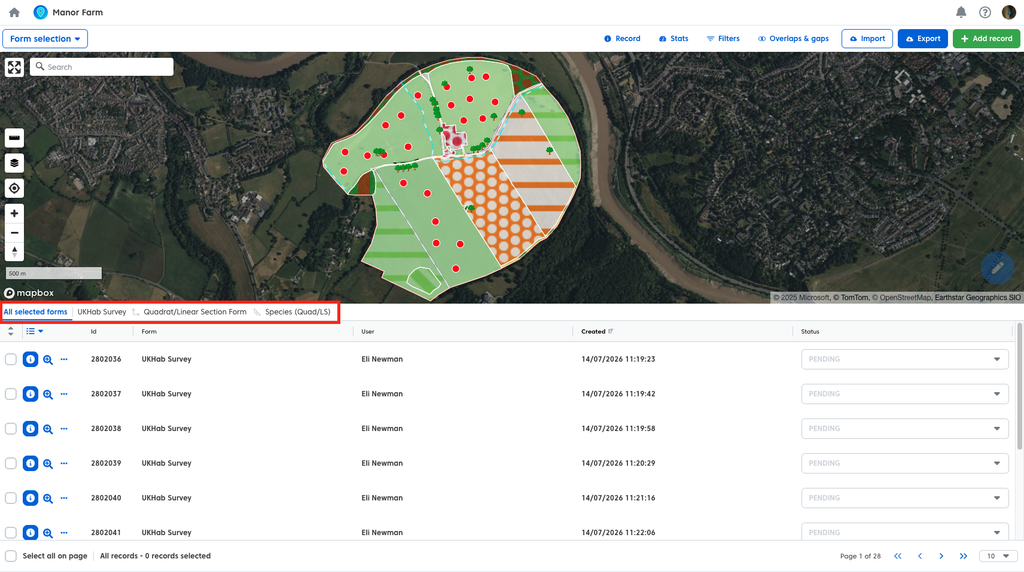
You can observe the relationships between forms via the small icon to the left of the form name. A right angle line connecting two points shows that the form is a subform of the form to the left. Multiple connected lines means the form is a subform of the form to the left which is itself a subform. To illustrate, in our example we have the UKHab survey form at the top level, the quadrat form is a subform of the UKhab survey and the Species (Quad/LS) is a subform of the quadrat form.

To view the data of a specific form simply:
- Select the form tab you wish to view.

Form Columns
You will note that the column headers in the table change depending on the selected form tab. By default each form tab will display columns corresponding to the questions within the form alongside some additional headers such as record id.
Note: UkHab forms have additional custom columns.
The visible columns can be edited by:
- Clicking the ‘edit column’ icon.

You can then show or hide columns by selecting them from the list in the dropdown menu.

Each column in the list also has a drag handle next to it.

You can use these handles to change the order of your forms in the table.
Note: When you export your data your CSV’s and attribute tables will respect the order of the columns as you have set them.
Once you have made your selections and adjustments these choices will remain fixed until you change them, allowing you to navigate between forms without needing to reselect your columns.
Pages
Depending on how many records you have against a form there will be multiple pages worth of record associated. You can either navigate through the pages by:
- Using the forward and back arrows.

Or:
- Jumping to the first or last page using the double arrows.

If you would prefer to see more of your records per page you can adjust the amount of records shown using the dropdown. By default 10 records are shown per page.

Selecting records
As well as selecting records on the map you can select records in the records table.
To select a record in the table:
- Click the row corresponding to the record you wish to select.
If you wish to select multiple records you can:
- Click the checkbox on the left of each record individually.

- Hold cmd (Mac) or ctrl (PC) and click multiple records, either on the map or in the table).
- Select a range of records by clicking the first record in your range, holding shift and then selecting teh last record in yoru range.
- Click ‘Select all on Page’ to select every record on the page you are currently viewing.
Note: Select all on page only selects the records on the page you are currently viewing.

Records remain selected between pages and forms, in other words you can multi-select records from different forms. To do so simply switch to another form and select your chosen records as normal.
When multiple records are selected a toolbar will appear, this toolbar informs you about how many records you currently have selected and provides you with the ability to perform certain bulk actions. You can apply bulk actions to records across multiple forms. These include:
- Assigning a status to a record (for more information on statuses see our user guide here).
- Delete records.

For the UKHab survey an additional option is present to assign strategic significance in bulk for baseline records and to assign level 2 habitat codes in bulk.
To deselect your records, you can:
- Click ‘De-select all on form’, to deselect all records on your currently selected form.

- Click the ‘x’ icon on the toolbar to deselect all records across all forms.

Additional Options
There are additional features you can use to interact with a singular record in your list. You can:
- Click the ‘3 dots’ icon to the left of a record.

This opens a menu which provides you with three options:

- Edit your record – This will open up a fully editable summary of your record. For more detail on editing records see our user guide here.
- Hide/Show your record – Enables you to hide/show your records on the map, any hidden records will have a ‘crossed out eye’ icon next to them.

- Delete your record – Deletes your record from the project. For more detail on deleting records see our user guide here.
You can also click the ‘magnifying glass’ icon to zoom the map to a specific record.

Records Detail View
The records detail view gives you a detailed breakdown of an individual record. To access it:
- Click the blue ‘i’ icon to the left of the record you wish to view.

- Double click the record on the map or in the records table.

The records detail view is a full summary of your record including all questions and associated geometry.
Note: The UKHab Survey and associated forms have their own unique version of the records view. See our user guide here (link) for more information.
If your record has any associated subforms these can be accessed via:
- The subform tab (denoted by the right angle line connecting two points icon.

- The individual subform records in the form summary.

Where you have multiple records associated with a sub form clicking the individual record wild display that records data in the summary window to the right.

Any photos will be shown in their place within a given form. You can also access all photos with a record and its associated subforms via the photos tab.

You can QA a record via the ‘Other info’ tab.

Here you can see all activity that has taken place in the record and there is a comments field available for any relevant comments.
Note: Anyone in a project may add comments to a record despite user permissions.

There are also options for interacting with your record data. You can:
- Export your data – (For a more detailed explanation on exporting see our user guide here.

- Edit your record (and any associated subform data) – (For a more detailed explanation on editing records see our user guide here.

Assign your record with a status – (For a more detailed explanation on Statuses see our user guide here).

Additional options can be found using the ‘More’ button.

These include:
- Cloning your record – this will create a perfect copy of your record, including all associated subform data.
- Save as a PDF – This will export a pdf or the record details page.
- Delete record – Will delete your record – (For a more detailed explanation on deleting records see our user guide here).

Additional Tools & Options
The records page also comes with several additional tools to help you more easily view and work with your data.
Record Information
The record information opens a sidepanel which provides you with key information of a given record without needing to enter the record detail view. You can also interact with the record directly via the Record Information sidepanel. To open the sidepanel:
- Click the ‘Record’ tab in the toolbar at the top of the map.


The sidepanel will populate with data as you hover over your records on the map. If you select a record, either by clicking on it on the map or choosing it in the records table, the data in the sidepanel will become fixed.

Note: The UKHab survey will display additional key data in the sidepanel.
If you wish to then view more of the data associated with your record you can access the record detail view via the Record Information sidepanel. To do so:
- Click the blue ‘View record’ button.

You can also hide/unhide your record as you would in the records table by:
- Clicking the ‘Hide on map’ button.

The option to edit your record is also accessible via the record information sidepanel.
- Click the ‘Edit record’ button (For a more detailed explanation on editing records see our user guide here).

Finally if you wish to delete your record you can do so by:
Clicking the ‘Delete record’ button (For a more detailed explanation on deleting records see our user guide here.

Stats
The stats tab provides you with the option of selecting any of your currently active forms and viewing a selection of key statistics (depending on the type of form it is). A form with polygonal geometries for example would show the total area of those geometries. To view these stats, first:
- Click the ‘Stats’ tab in the toolbar above the map.

Then:
- Select your chosen form from the dropdown menu.

Filters
Filters allow you to fine tune the form data visible both on the map and in the records table. To access filters:
- Click the ‘Filters’ tab in the toolbar above the map.

There are two types of filters you can use with your data, universal filters and form specific filters. Universal filters apply across all of your currently active forms, as such the universal filters apply to data that is found across all records, such as record creation date. Form specific filters relate to data found specific to the chosen form and only apply to that form.

You can also use filters in combination with the Stats tab, certain filtered information can be shown there depending on the filter you have active. Using UKhab as an example, if you filter by a certain habitat type you will be able to see the total area of that specific habitat in your stats for that form.
For a more detailed explanation of filters and how to use them see our user guide on the topic here.
Overlaps & Gaps
The overlaps and gaps tool is only applicable to forms which contain polygonal geometry data. The tool will highlight an overlapping geometries and any gaps between geometries in red and list these areas. Allowing you to correct them. To open the Overlaps and Gaps tool:
- Click the ‘Overlaps & gaps’ tab in the toolbar above the map.

The overlaps and gaps tool only applies to a single form, if you have multiple relevant forms active, you must:
- Select the relevant form from the dropdown menu in the sidepanel.
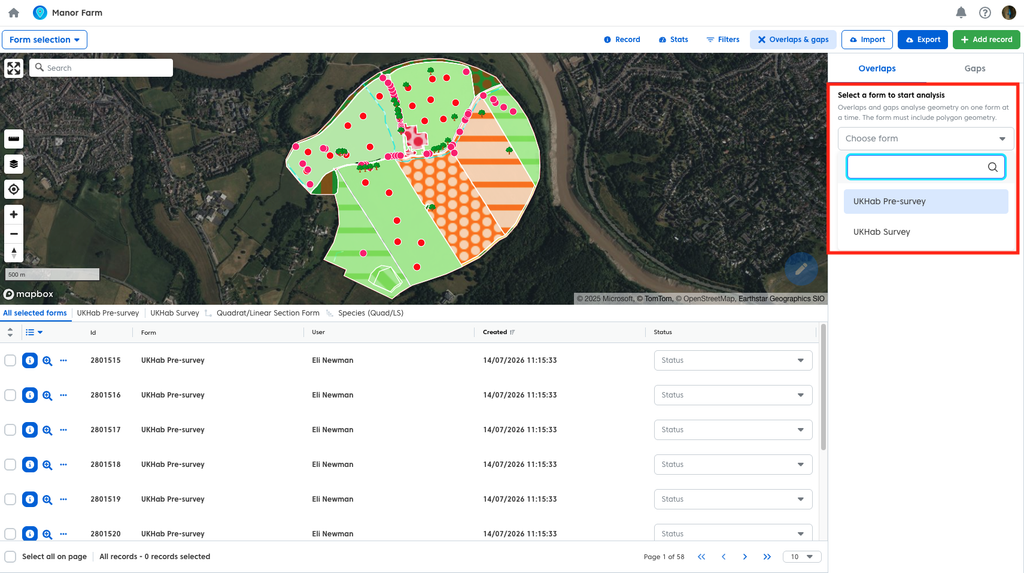
For a more detailed run through the Overlaps & Gaps tool see our UKHab user guide here.
Add record
Most of your records will be added to your project via the Coroe app. However there may be cases where you need to add a new record after the fact or where you are loading some previously collected data into Coreo. You can Add these records to your project directly by:
- Clicking the green ‘Add Record’ tab in the toolbar above the map.

Then:
- Select the form you wish to add your record too from the dropdown menu (only currentl
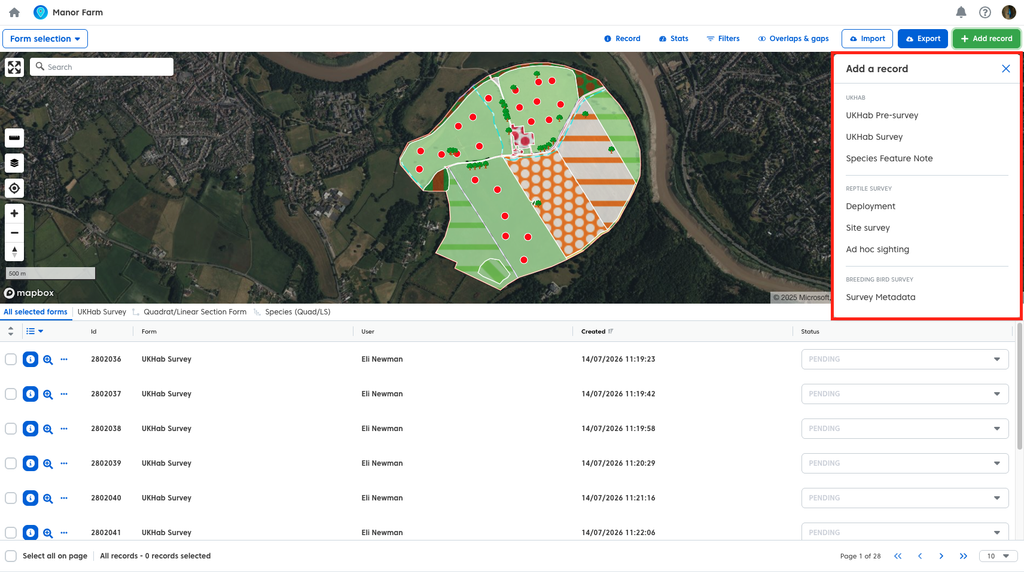
A record summary window will open, similar to the app.

Fill this in and complete to add your new record.
For a more detailed explanation of adding records to a project see our user guide here.
Export
Once you are happy with your data you can export it. To access your exports:
For a more detailed explanation of exporting see our user guide here.
- Click the blue ‘Export’ button in the upper right hand corner of the page.

You can specify which data you wish to export within these formats by:
- Exporting everything in your current ’view’ (all of your active forms).
- Exporting only the records you have currently selected).
- Exporting a form Group.
- Exporting data from an individual form.

Note: If you wish to export data from a subform you will need to do so via the overarching form that subform is associated with. To illustrate if we want to export our breeding bird species data we must have the ‘survey metadata’ form active, as the species form is nested within the survey metadata form. The export list will only show top level forms.


When working with UKHab data there are two additional UKHab only options:
- Export to the Metric Workbook – this saves a populated version of the metric workbook excel file
- Export UKHab Condition assessments – this saves a populated version of the Natural England Condition Assessment Excel spreadsheet
For a more detailed explanation of the UKHab export options see our user guide here.
There are several different options for exporting your data, these include:
- A dynamic and customizable map image
- CSV
- Shapefile
- GeoJSON
- Geopackage
- All media associated with your records

When exporting normally child and parent forms are kept separate meaning that you need to manually combine this data after export (as explained in our guide). To make this easier we have included the option to export combined data directly. After you have selected the forms you wish to export:
- Click the ‘Combine associated forms’ toggle.
