Introducing Maps & Boundaries
Coreo’s Maps & Boundaries page gives you control over how data from your project’s form layers is presented within the Coreo App, and also gives you the option to add additional layers with custom map imagery or add any other geospatial objects such as borders for your survey areas.
To access the page:
- Click the ‘Maps & Boundaries’ tab under ‘Build’ in the sidebar.

You will default to the ‘Custom’ section of the Maps & Boundaries page.
Adding Custom Layers
Coreo supports the addition of multiple additional layers to your map view, including Heatmaps, Raster images and Shapefiles.
To add additional layers, under the ‘Custom‘ section select the ‘Import custom layer’ button.

Individual guides are available describing in detail how to add each of the different types of additional layer:
- Heatmaps: Adding a Heatmap
- Raster images: Uploading map imagery
- Shapefiles: Adding a Vector Data
Modifying Form Layers
To customise form layers select ‘Forms’ to open the form section.

You can change the layer properties individually for each layer, and the options available will change depending on the features available, so for example if you record points on your survey for location/geometry, you will not get the option to change the properties for line-strings or polygons.
Taking a simple example, let’s assume you want to change the colour for Points on your map. In the image below, you can see we have one form layer called ‘Site’ with just Point available to edit. Currently points are set to be red.

We want to change these to be yellow with a blue border instead.
- Choose the “Primary color” swatch to select the base colour for your layer. In this example we have selected yellow. You can see that this also changes the point on the map for a real-time preview of how this will appear.

- Now select the border colour you’d like. We’ll choose a dark blue to contrast.

- You can increase the Border Width if you would like to make your point border more obvious, or change the Opacity of either the point or the border if you would like layers beneath to show through at some level.
- The same editing process applies to Line-Strings and Polygons, although different parameters will apply as appropriate to the shape.
- Use the ‘Save‘ button to save your edits.
Other Options
Real and test data
Test Data is shown on the map to show you how a point, a line-string and a polygon will be rendered on your map.
Viewing your changes in the Coreo app
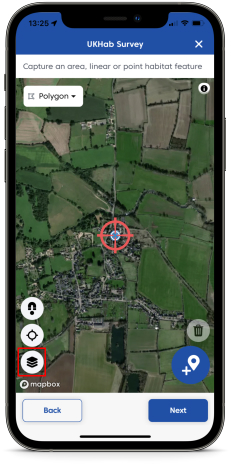
To view your Map Builder changes in the Coreo app, visit the relevant project and select the Layer Switcher icon.
- Scroll to the bottom of the window until you see the Map Layers section.
- Toggle the required layer to be visible so the eye icon is no longer crossed out.