Post-Intervention: Exporting your Scenarios
Once your plan is complete, you can export it to the statutory BNG metric or for use in external tools.
Exporting to the BNG Metric
To export your plan:
- Ensure your plan is saved using the ‘Save plan’ button in the plan tool bar.
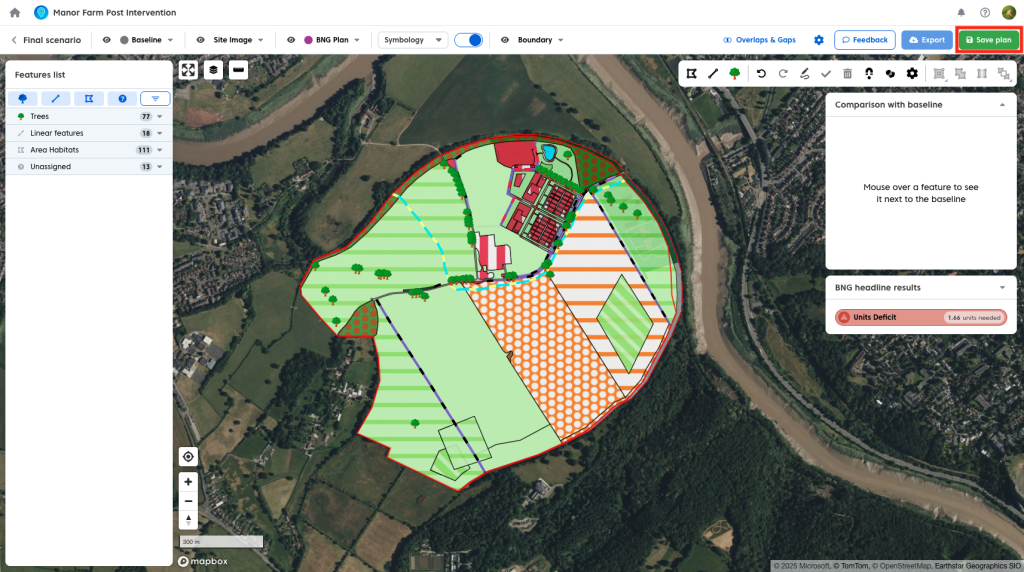
- Select the ‘Export’ button.

Choose either:
- Macro-enabled version

- Macro-disabled version

The export will populate the metric with your plan data, including:
- Baseline habitats, with retention, enhancement, and loss added to the correct columns
- Comments added to the comments column
- Enhancements added to the enhancement tab for all feature types
- Creations added to the created tabs for all feature types
- For creations and enhancements the Feature ID will include the new Coreo feature ID and feature name with the baseline Coreo ID and feature name it originated from in brackets after it
Multiple Enhancements on a Single Baseline Feature
If a baseline feature has multiple enhancements applied to it, this is reflected across the metric in a specific way.
In the Baseline tabs of the metric:
- If there are 0 or 1 enhancements, the feature will appear as a single row
- If there are 2 or more enhancements:
- The first row will include:
- The area of the first enhancement
- Any retained area of the baseline
- The first row will include:
Each additional enhancement will appear as a separate row, showing only the area of that enhancement
In the Enhancements tabs or the metric:
- Each enhancement will have its own row
- All rows will reference the original baseline feature
Feedback – If you have a preferred way for this behaviour to work, please let us know by submitting a support ticket
Off-site Exports
If your site is being used for off-site biodiversity units, this must be set in the plan settings before export.
To mark a plan as off-site:
- Open Plan Settings by clicking the cog icon in the plan toolbar
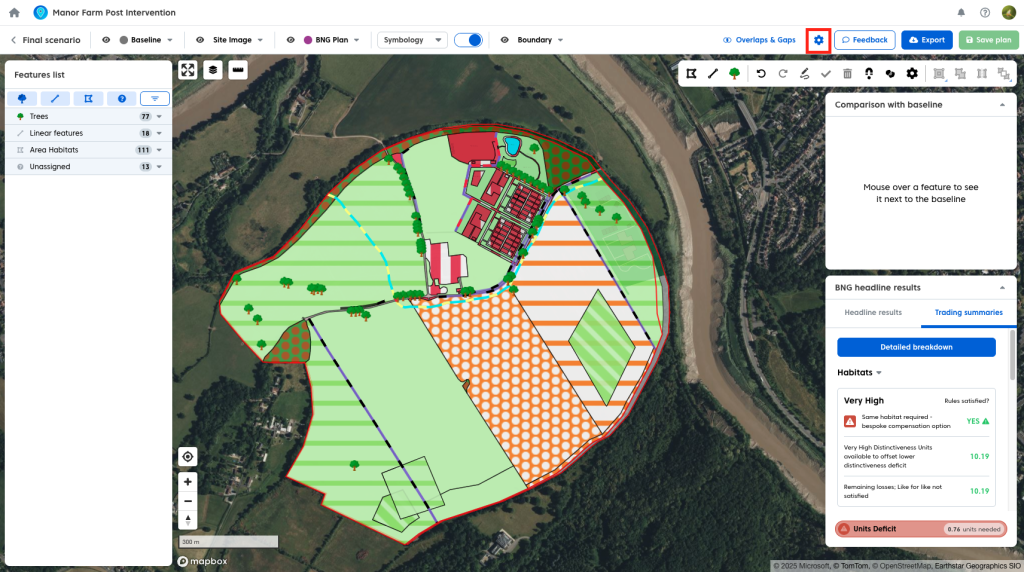
- Enable the off-site units option.

When enabled:
- Unit calculations will use off-site multipliers.
- The off-site sections of the metric will be populated.
Exporting Geometry
You can export your plan geometry for use in external tools.
You can export in 3 GIS formats:


Map Export
You can also generate map outputs directly from Coreo. This provides a quick way to generate presentation-ready maps from your plan. This map export tool functions in much teh same way as the UKHab Baseline export map. To create a map export of your plan:
- Click the ‘Export’ button.
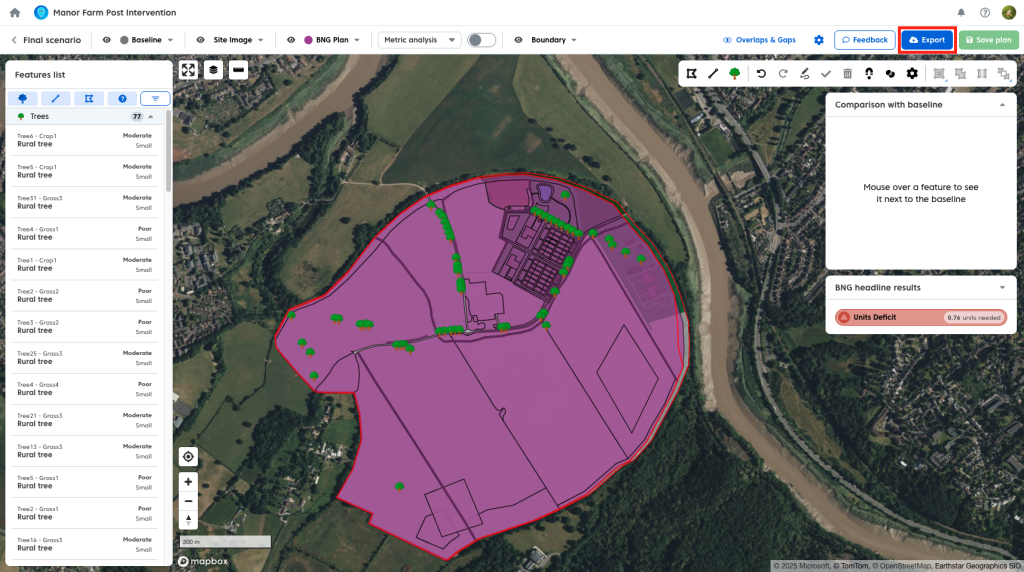
- Select ‘Export Map’
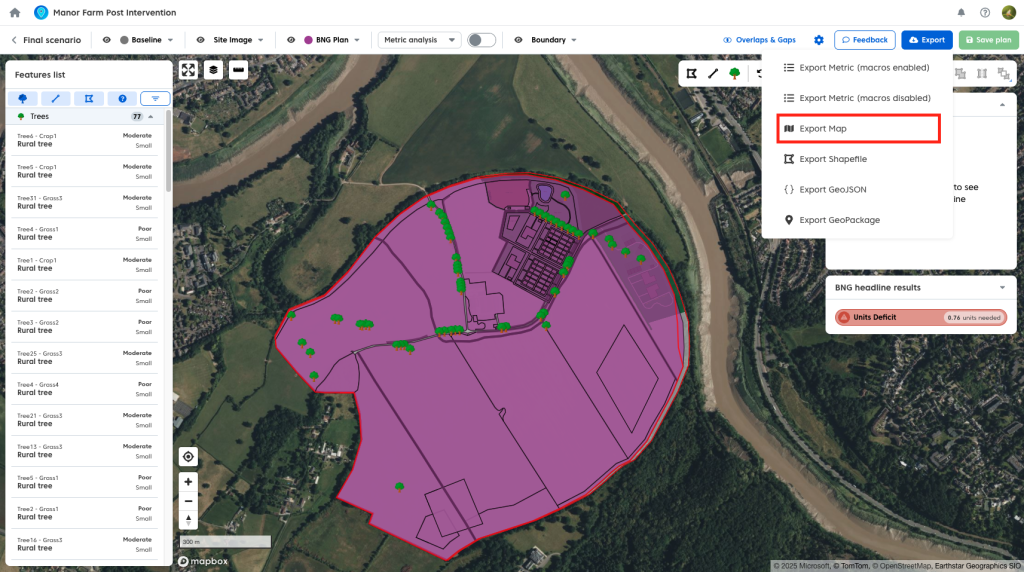
Your export map will display using the currently selected map styling.
Note: The styling toggle does not need to be on for it to apply to your map export.
For more information on the different styling options read our user guide here.
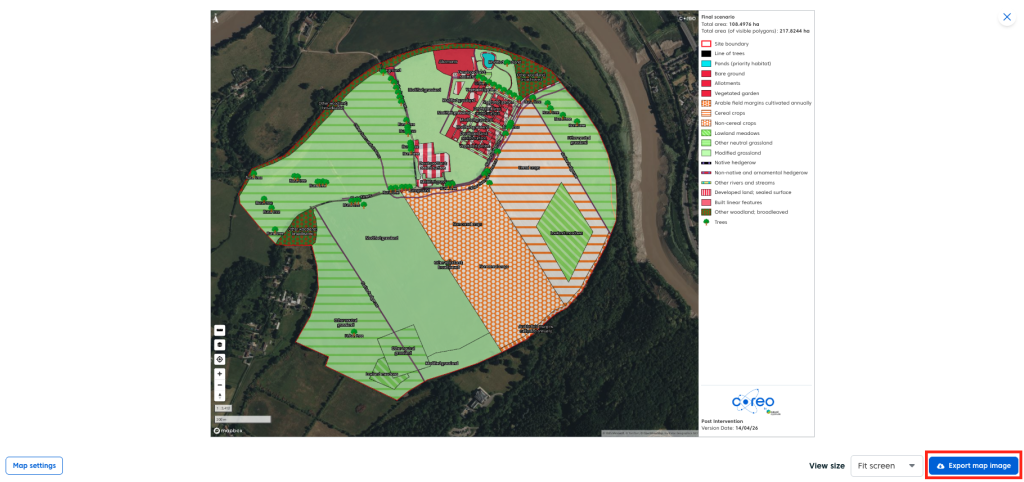
Once you have opened the tool you will be presented with a combined map and key.
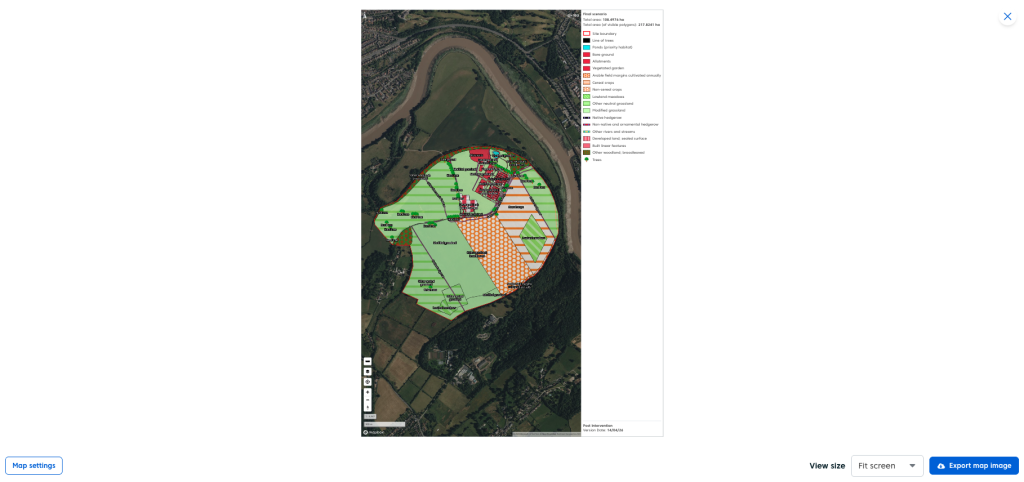
The map works in much the same way as the core map you are used to using in all other parts of the UKHab survey. You’ll notice that if you zoom in and out of your baseline the key will dynamically change to accomodate the habitats visible on your map
Map Settings
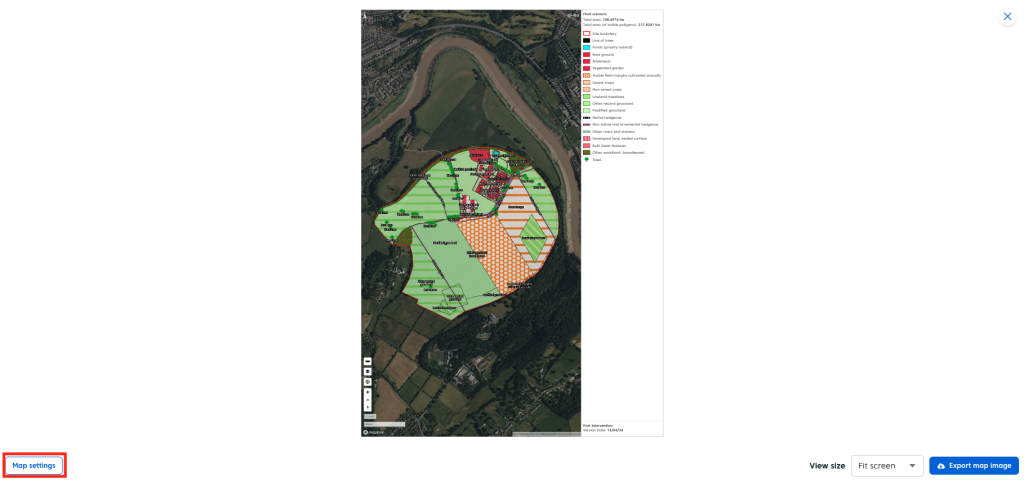
There are many different settings you can change to customise your map export. These are found in ‘Map Settings’. To open the window:
- Click the white ‘Map Settings’ button in the bottom left corner of the map export tool.
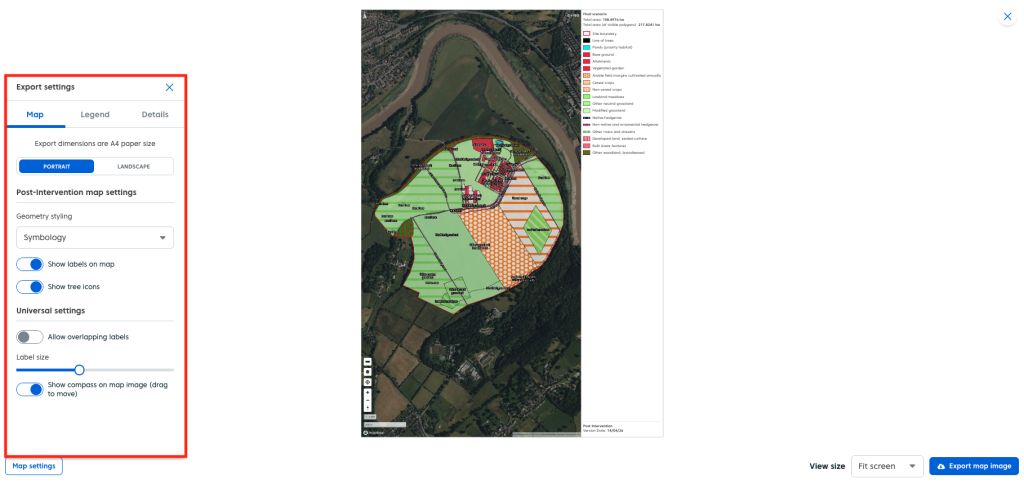
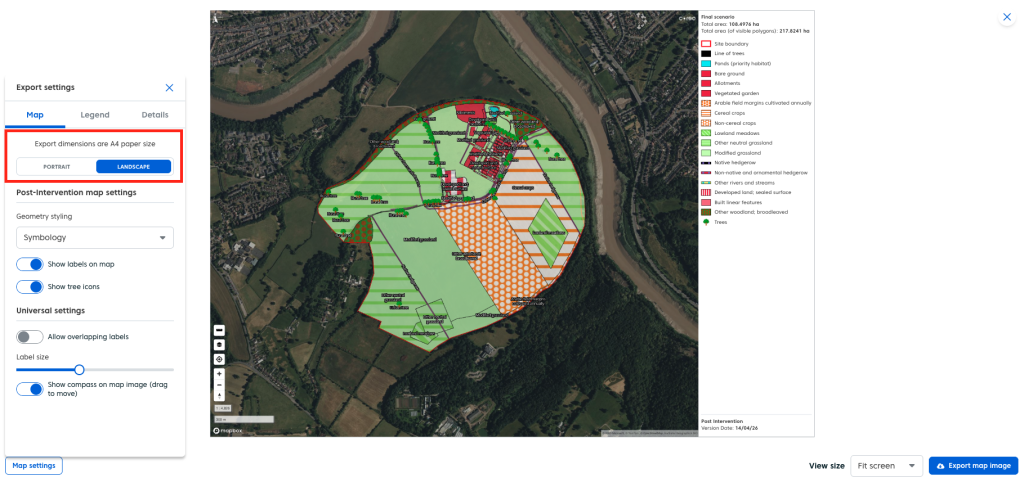
Map
The ‘Map’ tab will provide you with options for controlling how your map is presented for your export, this includes changing between landscape and portrait, which labels are visible, whether to show or hide your compass and how individual trees are presented on the map.
- To change between portrait and landscape mode simply click the option you wish to use for your export.
You can change the map styling your map is using by selecting your chosen styling using the dropdown menu.
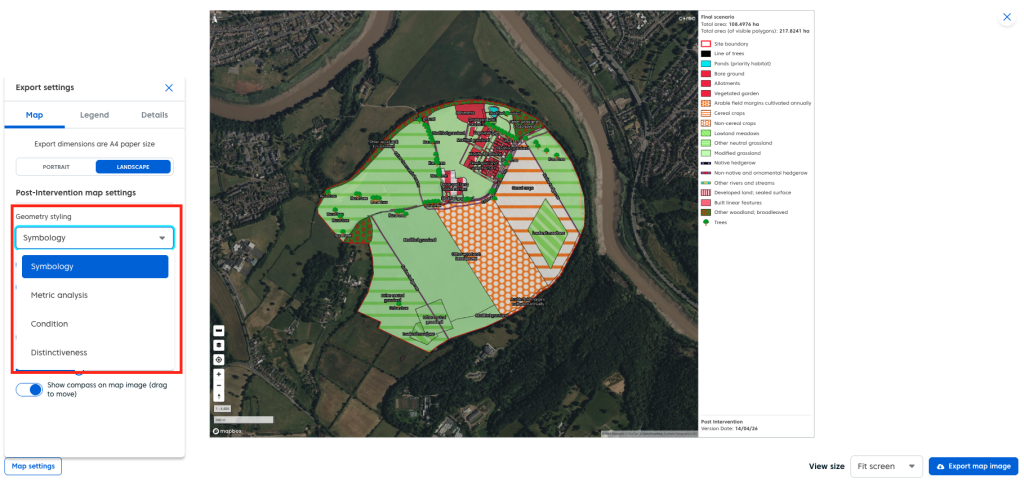
- You have additional options in the map tab:
- ‘Show Labels’ will hide or show the map labels.
- ‘Show tree icons’ will either show individual trees as simple point features when turned off or use the tree icon when turned on. This setting is on by default.
- ‘Allow overlapping labels’ will show all labels even if they would overlap, otherwise certain labels will be automatically hidden to ensure the map isn’t cluttered
- The ‘Label size’ slider will adjust the size of your labels, in scenarios where you have overlapping labels making them smaller can solve this problem, for example.
- ‘Show compass on map image (drag to move)’ this will show or hide the compass icon which is found in the upper left corner of the map by default. You can drag this icon anywhere on the map.
- In addition there is a Coreo logo on the top right of the map, whilst this cannot be hidden it can also be moved just like the compass.
Legend
The ‘Legend’ tab enable you to customise your legend. You can use it to change how your legend will be exported, whether your key will be shown in one or two columns, the size of the text and symbols in the key and what what additional information (codes, red line boundary area) you wish to display.
You can switch from 1 column in the key to 2, this provides more space for more items. To do so simply click which number of columns you want in your export.
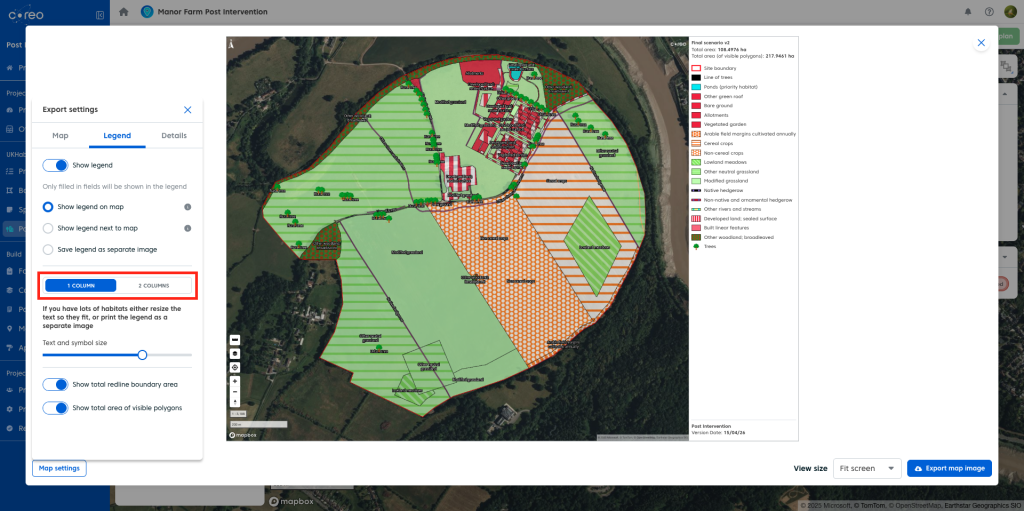
- There are several different options for exporting the legend:
- You can turn the legend off using the ‘Show legend’ toggle. This allows you to export just the map
- ‘Show legend on map’ will print the legen as part of the map, creating a combined image that fits an A4 aspect ratio
- ‘Show legend next to map‘ will combine the legend and the map but expand the size of the final image.
- ‘Save legend as separate image’ will create a separate image on export providing you with two images, the map and the legend.
- For larger projects the key can become too cluttered, with to many items in the key. To solve this there are two settings you can use:
- You can switch from 1 column in the key to 2, this provides more space for more items. To do so simply click which number of columns you want in your export.
- If two columns is not enough, you can change the size of the text and symbols in the key using the ‘Text and symbol size’ slider.
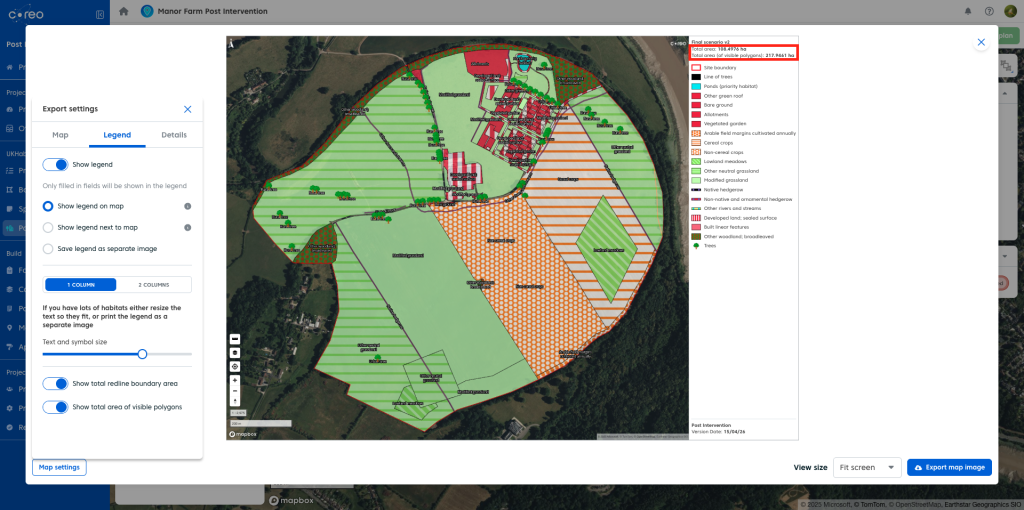
- You can also change what information is displayed in the key:
- ‘Show total redline boundary area’ will show or hide the total area of the projects redline boundary at the top of the legend.
- ‘Show total area of visible polygons’ will show or hide the total area of the polygons visible on the map at the top of the legend.
Details
The details tab lets you populate your legend with additional information. Such as a map title, project reference, map id etc. You can also add a company logo to your map export.
To add a logo to your map:
- Click the blue ‘Add logo’ button.
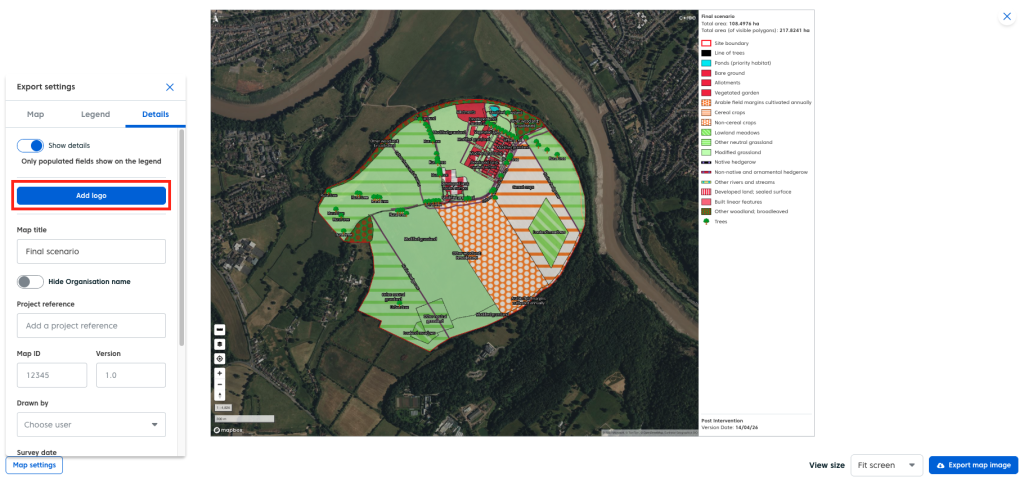
You will be prompted to select an image from your computer to upload. Onc you have done so your logo will be displayed in the bottom right hand corner of the legend.
If you wish to remove your logo and/or replace it:
- Click the red ‘bin’ icon next to the logo in the details tab.

As you fill in the details you wish to include on your export they will be dynamically added to the legend and vice versa should you wish to remove them.
Once you are happy with the layout and information on your map:
- Click the blue ‘Export map image’ button.